 Web Server Statistics for MeteorMusic.com Web Server Statistics for MeteorMusic.com
(Go To: Top: General Summary: Daily Summary: Hourly Summary: Domain Report: Organization Report: Operating System Report: Status Code Report: File Size Report: File Type Report: Directory Report: Request Report)
This report contains overall statistics.
Successful requests: 41,653
Average successful requests per day: 41,680
Successful requests for pages: 41,512
Average successful requests for pages per day: 41,539
Failed requests: 1,311
Redirected requests: 199
Distinct files requested: 270
Distinct hosts served: 315
Data transferred: 2.31 gigabytes
Average data transferred per day: 2.31 gigabytes
(Go To: Top: General Summary: Daily Summary: Hourly Summary: Domain Report: Organization Report: Operating System Report: Status Code Report: File Size Report: File Type Report: Directory Report: Request Report)
This report lists the total activity for each day of the week, summed over all the weeks in the report.
Each unit ( ) represents 1,000
requests for pages or part thereof.
) represents 1,000
requests for pages or part thereof.
day: #reqs: #pages: ---: -----: ------: Sun: 0: 0: Mon: 0: 0: Tue: 0: 0: Wed: 0: 0: Thu: 41653: 41512:Fri: 0: 0: Sat: 0: 0:
(Go To: Top: General Summary: Daily Summary: Hourly Summary: Domain Report: Organization Report: Operating System Report: Status Code Report: File Size Report: File Type Report: Directory Report: Request Report)
This report lists the total activity for each hour of the day, summed over all the days in the report.
Each unit () represents 50 requests
for pages or part thereof.
hour: #reqs: #pages: ----: -----: ------: 0: 2136: 2125:3: 1667: 1667:
5: 1914: 1910:
14: 1559: 1559:
(Go To: Top: General Summary: Daily Summary: Hourly Summary: Domain Report: Organization Report: Operating System Report: Status Code Report: File Size Report: File Type Report: Directory Report: Request Report)
This report lists the countries of the computers which requested files.
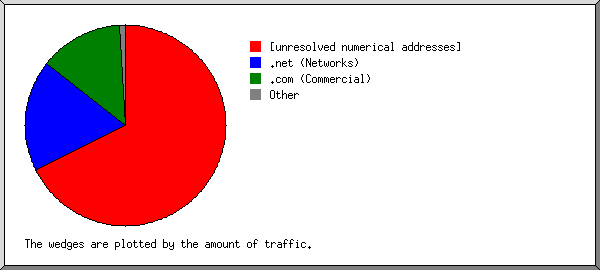
Listing domains, sorted by the amount of traffic.
#reqs: %bytes: domain
-----: ------: ------
 3829: 83.12%: [unresolved numerical addresses]
  575: 12.17%: .net (Networks)
  278:  4.40%: .com (Commercial)
   13:  0.10%: [unknown domain]
    3:  0.08%: .il (Israel)
  147:  0.06%: .ru (Russia)
   19:  0.03%: .edu (US Higher Education)
    1:  0.03%: .id (Indonesia)
    6:  0.01%: .dk (Denmark)
    7:       : .tz (Tanzania)
    2:       : .br (Brazil)
    4:       : .co (Colombia)
   18:       : .org (Non Profit Making Organizations)
    3:       : .io (British Indian Ocean Territory)
 5552:       : .de (Germany)
31115:       : .pt (Portugal)
   72:       : .ws (Samoa)
    9:       : .cz (Czech Republic)
(Go To: Top: General Summary: Daily Summary: Hourly Summary: Domain Report: Organization Report: Operating System Report: Status Code Report: File Size Report: File Type Report: Directory Report: Request Report)
This report lists the organizations of the computers which requested files.
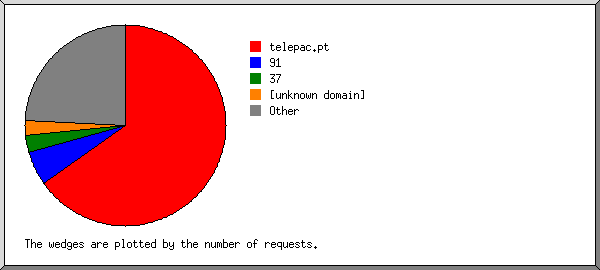
Listing the top 20 organizations by the number of requests, sorted by the number of requests.
#reqs: %bytes: organization
-----: ------: ------------
31115:       : telepac.pt
 5550:       : your-server.de
 2524: 74.86%: 37
  695:       : 91
  248:  5.70%: 94
  214:  5.72%: as54203.net
  140:  3.90%: as22781.net
  103:       : ovh.net
   96:  0.03%: 191.101
   92:  0.04%: omkc.ru
   82:  1.82%: amazonaws.com
   74:  1.68%: 176.67
   72:       : ws
   58:  0.01%: 4
   57:  1.40%: as54138.net
   49:       : serv-dns.ru
   44:  1.25%: semrush.com
   44:  0.68%: ahrefs.com
   38:  1.04%: as140952.net
   35:       : phpwebhosting.com
  323:  1.85%: [not listed: 95 organizations]
(Go To: Top: General Summary: Daily Summary: Hourly Summary: Domain Report: Organization Report: Operating System Report: Status Code Report: File Size Report: File Type Report: Directory Report: Request Report)
This report lists the operating systems used by visitors.
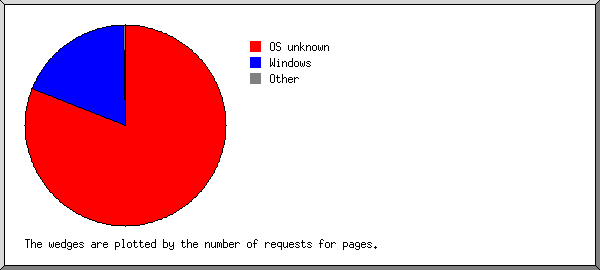
Listing operating systems, sorted by the number of requests for pages.
 #: #reqs: #pages: OS
--: -----: ------: --
 1: 36874:  36807: OS unknown
 2:  4610:   4594: Windows
  :  3064:   3048:   Windows NT
  :  1544:   1544:   Unknown Windows
  :     2:      2:   Windows XP
 3:    70:     57: Known robots
 4:    35:     21: Unix
  :    35:     21:   Linux
 5:    43:     12: Macintosh
(Go To: Top: General Summary: Daily Summary: Hourly Summary: Domain Report: Organization Report: Operating System Report: Status Code Report: File Size Report: File Type Report: Directory Report: Request Report)
This report lists the HTTP status codes of all requests.
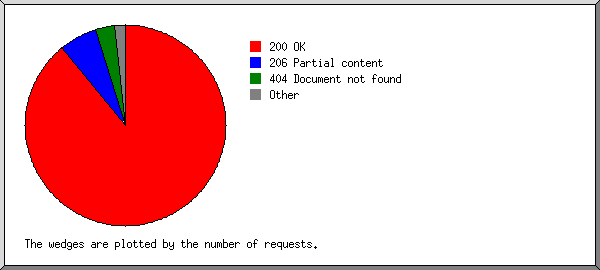
Listing status codes, sorted numerically.
#reqs: status code
-----: -----------
40946: 200 OK
  695: 206 Partial content
  193: 301 Document moved permanently
    6: 302 Document found elsewhere
   12: 304 Not modified since last retrieval
   21: 400 Bad request
    3: 401 Authentication required
 1053: 404 Document not found
    6: 405 Method not allowed
  194: 500 Internal server error
   34: 501 Request type not supported
(Go To: Top: General Summary: Daily Summary: Hourly Summary: Domain Report: Organization Report: Operating System Report: Status Code Report: File Size Report: File Type Report: Directory Report: Request Report)
This report lists the sizes of files.
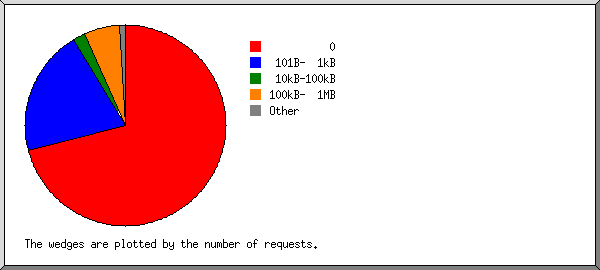
       size: #reqs: %bytes:
-----------: -----: ------:
          0: 37593:       :
   1B-  10B:    36:       :
  11B- 100B:     3:       :
 101B-  1kB:   150:       :
  1kB- 10kB:    72:  0.01%:
 10kB-100kB:   329:  0.21%:
100kB-  1MB:  3469: 99.71%:
  1MB- 10MB:     1:  0.07%:
(Go To: Top: General Summary: Daily Summary: Hourly Summary: Domain Report: Organization Report: Operating System Report: Status Code Report: File Size Report: File Type Report: Directory Report: Request Report)
This report lists the extensions of files.

Listing extensions with at least 0.1% of the traffic, sorted by the amount of traffic.
#reqs: %bytes: extension
-----: ------: ---------
 3464: 99.36%: .html [Hypertext Markup Language]
   11:  0.27%: .current
38047:  0.17%: [directories]
  131:  0.20%: [not listed: 11 extensions]
(Go To: Top: General Summary: Daily Summary: Hourly Summary: Domain Report: Organization Report: Operating System Report: Status Code Report: File Size Report: File Type Report: Directory Report: Request Report)
This report lists the directories from which files were requested. (The figures for each directory include all of its subdirectories.)
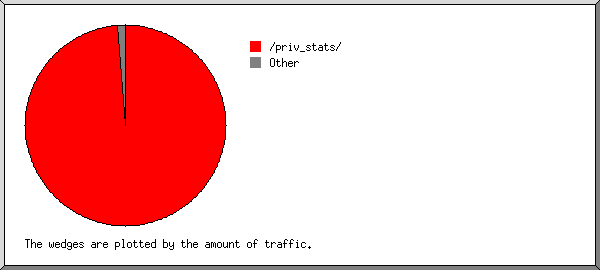
Listing directories with at least 0.01% of the traffic, sorted by the amount of traffic.
#reqs: %bytes: directory
-----: ------: ---------
 9231: 99.72%: /priv_stats/
  128:  0.15%: /DHA/
32184:  0.11%: [root directory]
   45:  0.02%: http://
   65:  0.01%: [not listed: 4 directories]
(Go To: Top: General Summary: Daily Summary: Hourly Summary: Domain Report: Organization Report: Operating System Report: Status Code Report: File Size Report: File Type Report: Directory Report: Request Report)
This report lists the files on the site.
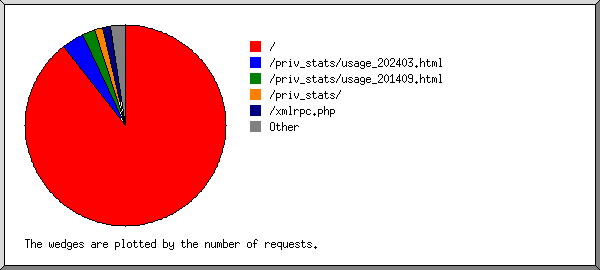
Listing files with at least 20 requests, sorted by the number of requests.
#reqs: %bytes:          last time: file
-----: ------: ------------------: ----
32178:  0.04%: Apr/25/24 11:59 PM: /
 5748:  0.08%: Apr/25/24 11:48 PM: /priv_stats/
 2518: 74.75%: Apr/25/24 11:58 PM: /priv_stats/usage_202403.html
  521: 14.25%: Apr/25/24 11:58 PM: /priv_stats/usage_201409.html
  247:  5.73%: Apr/25/24 11:54 PM: /priv_stats/usage_202404.html
   35:       : Apr/25/24 11:26 PM: /DHA/wp-cron.php
   25:  0.01%: Apr/25/24  3:16 PM: http://meteormusic.com/priv_stats/
   20:  0.01%: Apr/25/24  1:25 PM: http://www.meteormusic.com/priv_stats/
  361:  5.14%: Apr/25/24 11:55 PM: [not listed: 212 files]
(Go To: Top: General Summary: Daily Summary: Hourly Summary: Domain Report: Organization Report: Operating System Report: Status Code Report: File Size Report: File Type Report: Directory Report: Request Report)

