 Web Server Statistics for MeteorMusic.com Web Server Statistics for MeteorMusic.com
(Go To: Top: General Summary: Daily Summary: Hourly Summary: Domain Report: Organization Report: Operating System Report: Status Code Report: File Size Report: File Type Report: Directory Report: Request Report)
This report contains overall statistics.
Successful requests: 6,067
Average successful requests per day: 6,066
Successful requests for pages: 5,352
Average successful requests for pages per day: 5,351
Failed requests: 1,300
Redirected requests: 13
Distinct files requested: 421
Distinct hosts served: 393
Corrupt logfile lines: 140
Data transferred: 1.98 gigabytes
Average data transferred per day: 1.98 gigabytes
(Go To: Top: General Summary: Daily Summary: Hourly Summary: Domain Report: Organization Report: Operating System Report: Status Code Report: File Size Report: File Type Report: Directory Report: Request Report)
This report lists the total activity for each day of the week, summed over all the weeks in the report.
Each unit ( ) represents 150 requests
for pages or part thereof.
) represents 150 requests
for pages or part thereof.
day: #reqs: #pages: ---: -----: ------: Sun: 0: 0: Mon: 6064: 5349:Tue: 3: 3:
(Go To: Top: General Summary: Daily Summary: Hourly Summary: Domain Report: Organization Report: Operating System Report: Status Code Report: File Size Report: File Type Report: Directory Report: Request Report)
This report lists the total activity for each hour of the day, summed over all the days in the report.
Each unit () represents 15 requests
for pages or part thereof.
hour: #reqs: #pages: ----: -----: ------: 0: 189: 172:14: 228: 210:
15: 196: 178:
(Go To: Top: General Summary: Daily Summary: Hourly Summary: Domain Report: Organization Report: Operating System Report: Status Code Report: File Size Report: File Type Report: Directory Report: Request Report)
This report lists the countries of the computers which requested files.
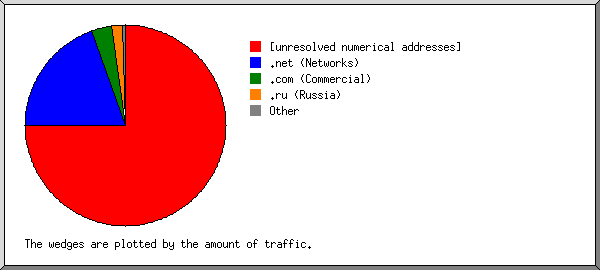
Listing domains, sorted by the amount of traffic.
#reqs: %bytes: domain
-----: ------: ------
 2562: 81.22%: [unknown domain]
 1680:  4.91%: [unresolved numerical addresses]
  603:  4.69%: .ru (Russia)
  215:  4.66%: .net (Networks)
  675:  3.38%: .com (Commercial)
   22:  0.64%: .io (British Indian Ocean Territory)
   20:  0.32%: .de (Germany)
  236:  0.11%: .tz (Tanzania)
    1:  0.04%: .arpa (Arpanet)
    5:  0.02%: .vn (Vietnam)
   12:       : .kz (Kazakhstan)
    9:       : .org (Non Profit Making Organizations)
    3:       : .it (Italy)
    8:       : .mx (Mexico)
    5:       : .cz (Czech Republic)
    2:       : .info (Informational)
    2:       : .in (India)
    1:       : .jp (Japan)
    1:       : .pt (Portugal)
    1:       : [domain not given]
    1:       : .ca (Canada)
    1:       : .id (Indonesia)
    1:       : .uk (United Kingdom)
    1:       : .sh (Saint Helena)
(Go To: Top: General Summary: Daily Summary: Hourly Summary: Domain Report: Organization Report: Operating System Report: Status Code Report: File Size Report: File Type Report: Directory Report: Request Report)
This report lists the organizations of the computers which requested files.
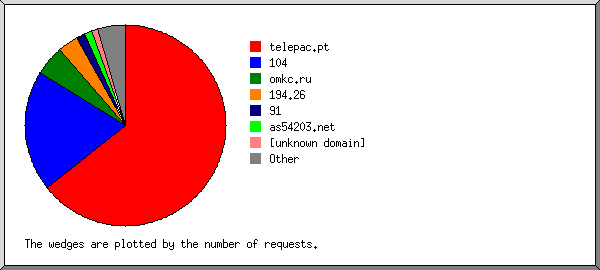
Listing the top 20 organizations by the number of requests, sorted by the number of requests.
#reqs: %bytes: organization
-----: ------: ------------
 2562: 81.22%: [unknown domain]
  795:       : 91
  450:  0.22%: omkc.ru
  306:  0.63%: amazonaws.com
  236:  0.11%: tz
  185:       : phpwebhosting.com
  180:       : 5
  132:  4.36%: natanet.ru
  100:  2.57%: ahrefs.net
   99:       : 168.196
   93:       : 138.59
   78:  0.07%: 138.219
   67:  1.93%: as62651.net
   59:  0.05%: 206.189
   58:  0.01%: 167.71
   47:  1.49%: semrush.com
   25:  0.84%: 220.93
   24:  0.83%: 185.228
   23:  0.01%: 129.152
   22:  0.64%: io
  526:  5.03%: [not listed: 153 organizations]
(Go To: Top: General Summary: Daily Summary: Hourly Summary: Domain Report: Organization Report: Operating System Report: Status Code Report: File Size Report: File Type Report: Directory Report: Request Report)
This report lists the operating systems used by visitors.
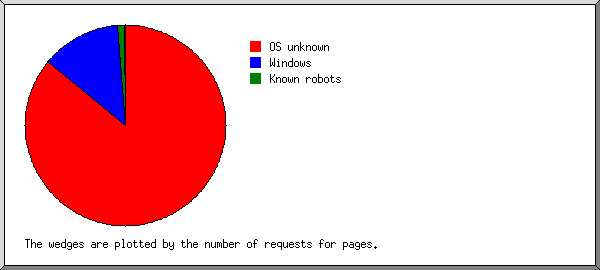
Listing operating systems, sorted by the number of requests for pages.
 #: #reqs: #pages: OS
--: -----: ------: --
 1:  4513:   4217: Windows
  :  2588:   2296:   Windows NT
  :  1925:   1921:   Unknown Windows
 2:  1182:    878: OS unknown
 3:   156:    112: Known robots
 4:   117:     87: Macintosh
 5:    86:     46: Unix
  :    86:     46:   Linux
(Go To: Top: General Summary: Daily Summary: Hourly Summary: Domain Report: Organization Report: Operating System Report: Status Code Report: File Size Report: File Type Report: Directory Report: Request Report)
This report lists the HTTP status codes of all requests.
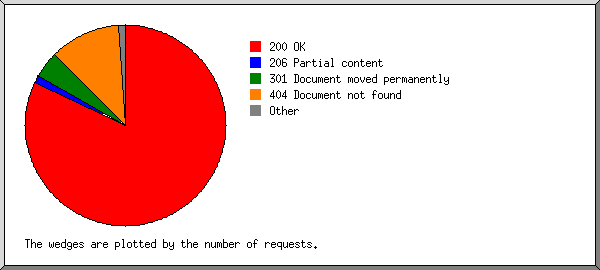
Listing status codes, sorted numerically.
#reqs: status code
-----: -----------
 5235: 200 OK
  825: 206 Partial content
    8: 301 Document moved permanently
    5: 302 Document found elsewhere
    7: 304 Not modified since last retrieval
   96: 400 Bad request
    2: 403 Access forbidden
 1012: 404 Document not found
    1: 405 Method not allowed
  160: 500 Internal server error
   29: 501 Request type not supported
(Go To: Top: General Summary: Daily Summary: Hourly Summary: Domain Report: Organization Report: Operating System Report: Status Code Report: File Size Report: File Type Report: Directory Report: Request Report)
This report lists the sizes of files.
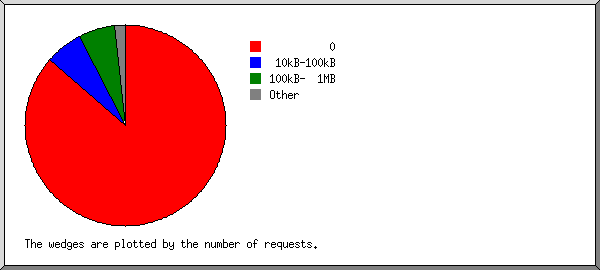
       size: #reqs: %bytes:
-----------: -----: ------:
          0:   984:       :
   1B-  10B:   188:       :
  11B- 100B:     1:       :
 101B-  1kB:   801:  0.01%:
  1kB- 10kB:   230:  0.05%:
 10kB-100kB:   771:  0.44%:
100kB-  1MB:  3091: 99.45%:
  1MB- 10MB:     1:  0.05%:
(Go To: Top: General Summary: Daily Summary: Hourly Summary: Domain Report: Organization Report: Operating System Report: Status Code Report: File Size Report: File Type Report: Directory Report: Request Report)
This report lists the extensions of files.
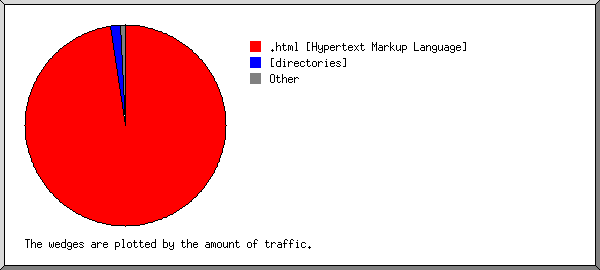
Listing extensions with at least 0.1% of the traffic, sorted by the amount of traffic.
#reqs: %bytes: extension
-----: ------: ---------
 3101: 99.34%: .html [Hypertext Markup Language]
 2247:  0.44%: [directories]
  719:  0.22%: [not listed: 11 extensions]
(Go To: Top: General Summary: Daily Summary: Hourly Summary: Domain Report: Organization Report: Operating System Report: Status Code Report: File Size Report: File Type Report: Directory Report: Request Report)
This report lists the directories from which files were requested. (The figures for each directory include all of its subdirectories.)
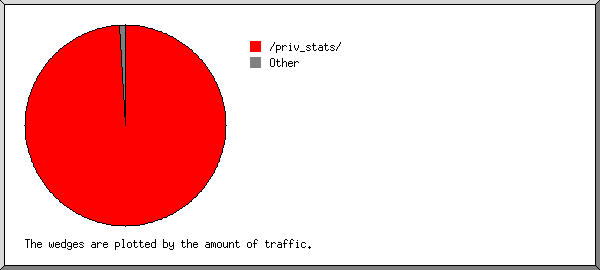
Listing directories with at least 0.01% of the traffic, sorted by the amount of traffic.
#reqs: %bytes: directory
-----: ------: ---------
 3770: 99.68%: /priv_stats/
 1869:  0.15%: [root directory]
  218:  0.07%: /DHA/
   79:  0.07%: http://
   70:  0.01%: /wp-includes/
   61:  0.01%: [not listed: 3 directories]
(Go To: Top: General Summary: Daily Summary: Hourly Summary: Domain Report: Organization Report: Operating System Report: Status Code Report: File Size Report: File Type Report: Directory Report: Request Report)
This report lists the files on the site.
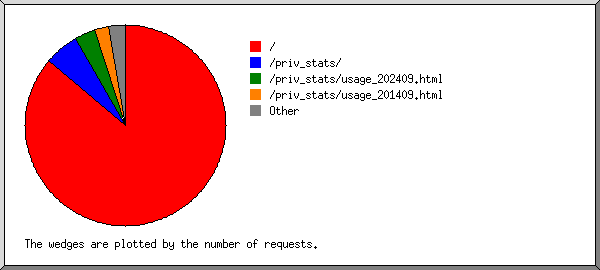
Listing files with at least 20 requests, sorted by the number of requests.
#reqs: %bytes:          last time: file
-----: ------: ------------------: ----
 2158: 67.92%: Mar/11/25 12:00 AM: /priv_stats/usage_202501.html
 1402:  0.06%: Mar/10/25 11:57 PM: /
  633:  0.31%: Mar/11/25 12:00 AM: /priv_stats/
  342:  0.01%: Mar/10/25 11:52 PM: /xmlrpc.php
  205:  7.06%: Mar/10/25 11:55 PM: /priv_stats/usage_202402.html
  204:  7.06%: Mar/10/25 11:58 PM: /priv_stats/usage_202403.html
  185:       : Mar/10/25 11:52 PM: /DHA/wp-cron.php
  184:  6.07%: Mar/10/25 11:20 PM: /priv_stats/usage_202503.html
  109:  0.03%: Mar/10/25 11:52 PM: /wp-login.php
   59:  2.00%: Mar/10/25 11:34 PM: /priv_stats/usage_201409.html
   41:  0.02%: Mar/10/25 11:00 PM: http://meteormusic.com/priv_stats/
   37:  0.02%: Mar/10/25 10:08 PM: http://www.meteormusic.com/priv_stats/
   32:  1.09%: Mar/10/25 11:52 PM: /priv_stats/usage_202206.html
   25:  0.85%: Mar/10/25 11:05 PM: /priv_stats/usage_202107.html
   21:  0.74%: Mar/10/25 11:12 PM: /priv_stats/usage_202101.html
  430:  6.75%: Mar/10/25 11:57 PM: [not listed: 211 files]
(Go To: Top: General Summary: Daily Summary: Hourly Summary: Domain Report: Organization Report: Operating System Report: Status Code Report: File Size Report: File Type Report: Directory Report: Request Report)


